N5PA Propagation Page
| Solar Indicies |
| Solar Flux: | 180 | Sunspot#: | 158 | HF Indicators | VHF Indicators |
| A-Index: | 22 Ap | K-Index: | 3 Kp | Band | Day | Night | Item | Status |
| Geomag Fld: | UNSETTLD | Sig Noise: | S2-S3 | 80m-40m | Poor | Fair | Aurora: | Band Closed |
| X-Ray: | C1.2 | Solar Wind: | 437.4 KM/Sec | 30m-20m | Good | Good | 2m EU Es: | Band Closed |
| Flare Class: | C | Proton Flux: | 2260 keV | 17m-15m | Good | Good | 2m NA Es: | Band Closed |
| Electron Flux: | 105000 keV | Magnetic Fld: | BZ: 1.6nT | 12m-10m | Good | Poor | 6m Eu Es: | Band Closed |
| Aurora: | 3/n=1.99 | Aurora Lat: | 65.6° | 304A: | 141.0 @ SEM | 4m EU Es: | Band Closed |
| MUF: | NoRptMHz | foF2: | MHz | MUF Factor: | MHz | | |
Solar Data Provided by N0NBH
Current Solar Conditions
| XRay Flare Class: | C Moderate |
| Geomagnetic Field: | 3 Unsettled |
U.S. Dept. of Commerce, NOAA, Space Weather Prediction Center
3-Day Solar Forecast
U.S. Dept. of Commerce, NOAA, Space Weather Prediction Center
27-Day Solar Forecast
Latest CME Model (Goddard)
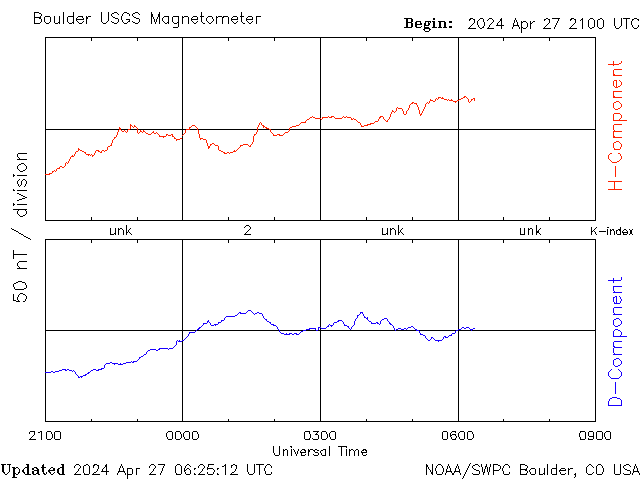
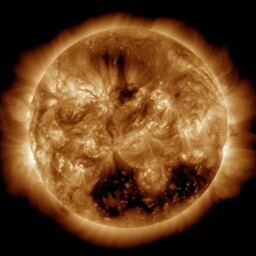
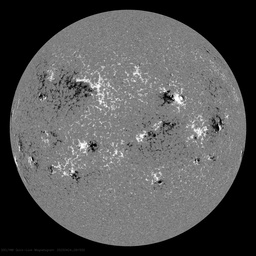
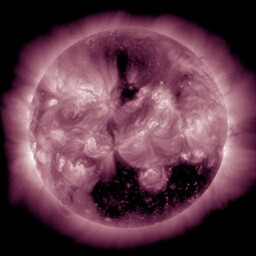
Latest Observations
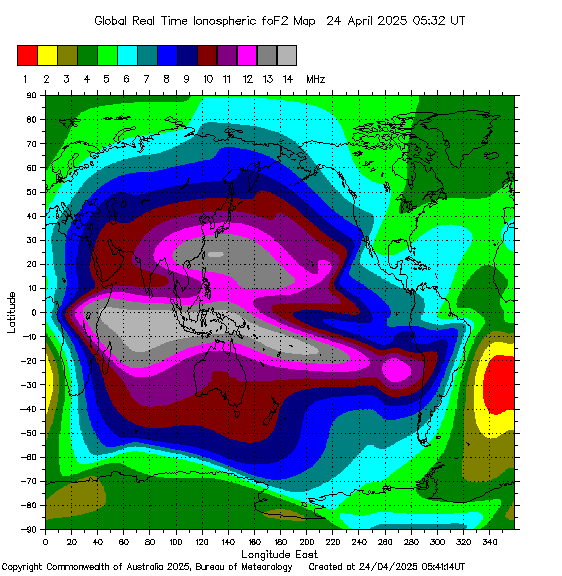
Global Real Time Ionospheric foF2 Map
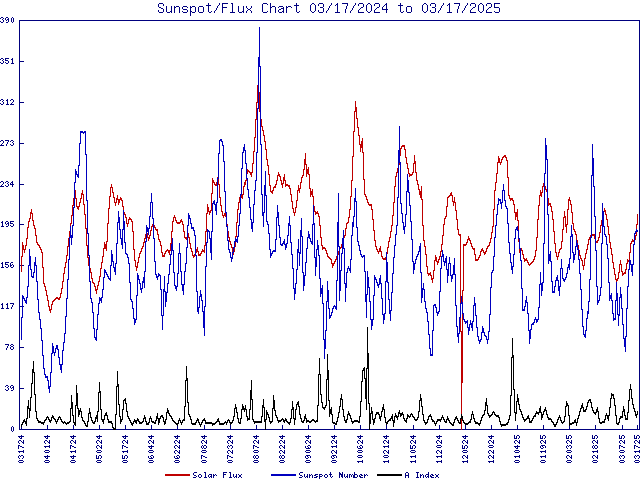
Sunspot/Flux Chart
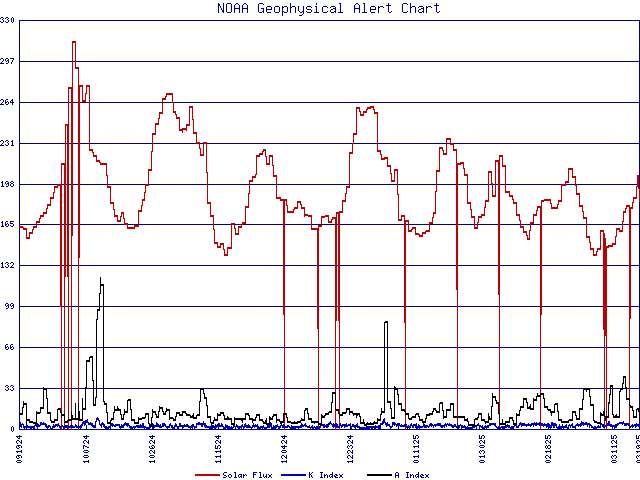
NOAA Geophysical Alert Chart
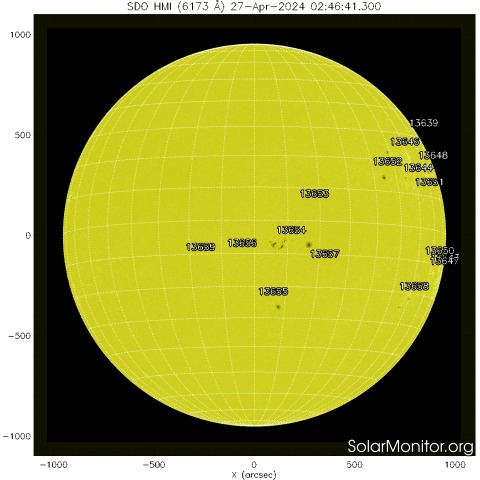
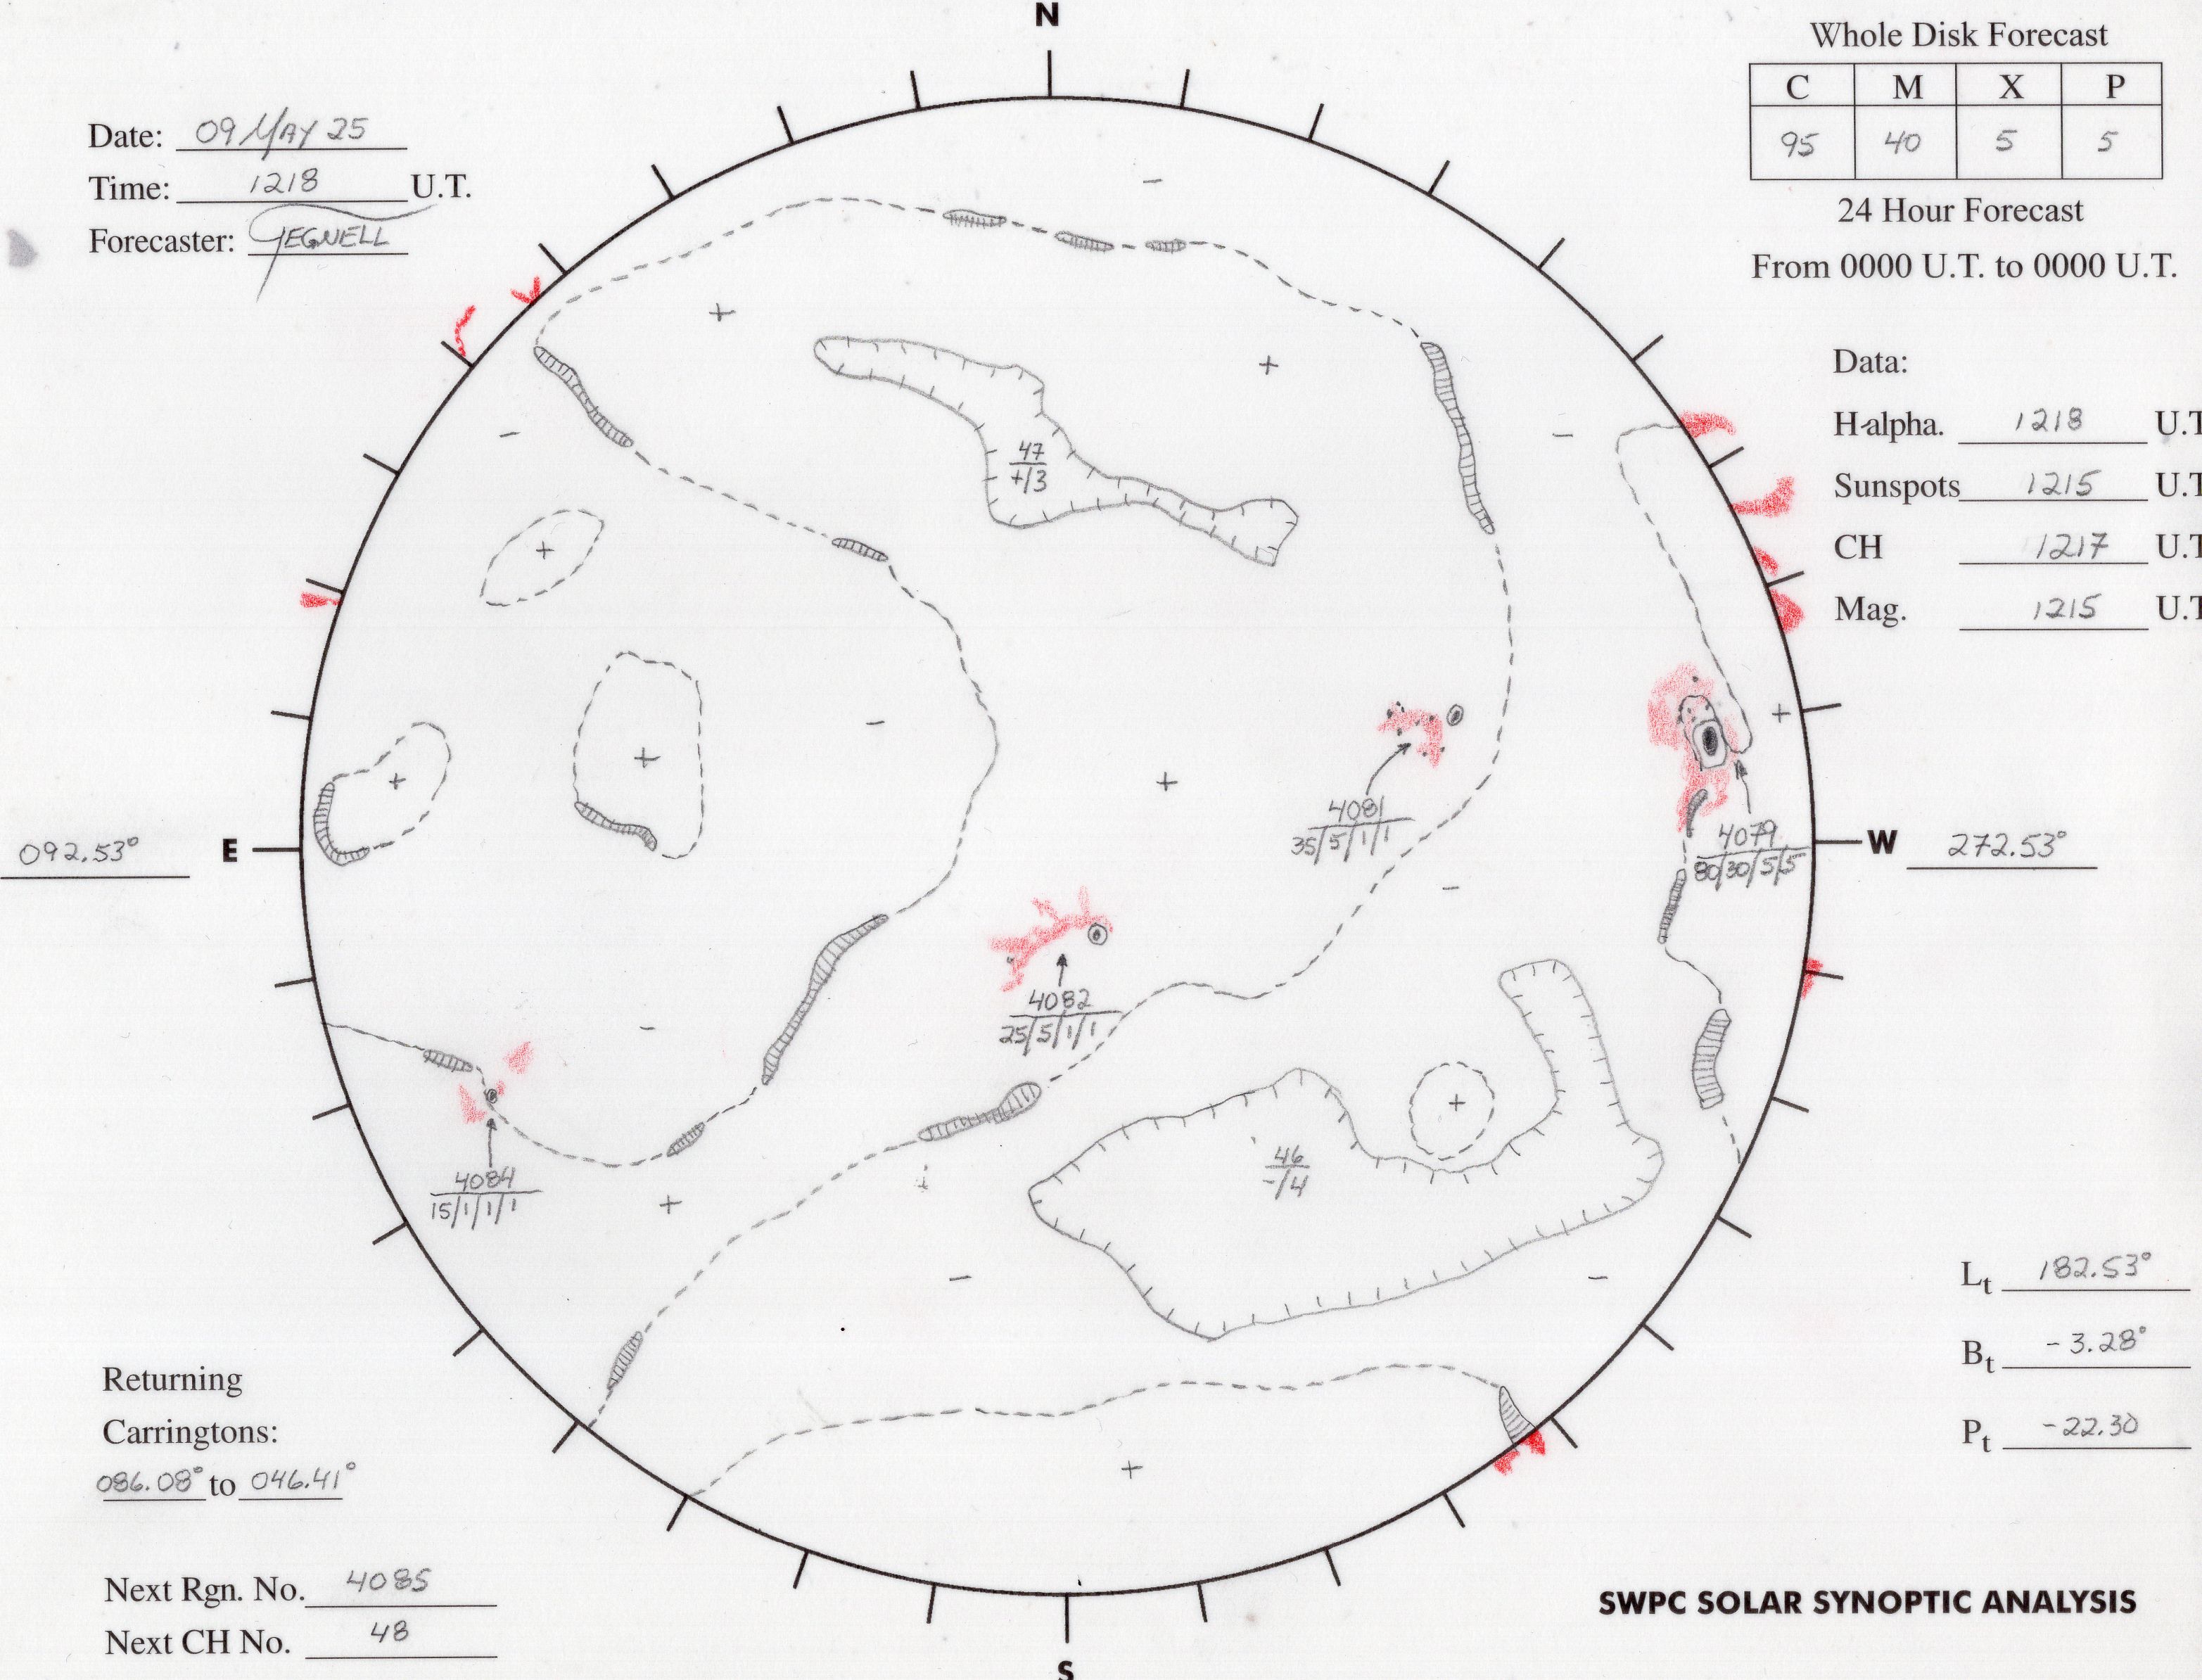
SolarMonitor.org - Numbered Sunspot Regions and Plages
Time and Date - Gray Line Map

Click on Map to see Larger View.
Auroral Activity Extrapolated from NOAA POES
Instruments on board the NOAA Polar-orbiting Operational Environmental Satellite (POES) continually monitor the power flux carried by the protons and electrons that produce aurora in the atmosphere. SWPC has developed a technique that uses the power flux observations obtained during a single pass of the satellite over a polar region (which takes about 25 minutes) to estimate the total power deposited in an entire polar region by these auroral particles.
The power input estimate is converted to an auroral activity index that ranges from 1 to 10.
Geomagnetic Indices and Conditions
| Kp Index | Ap Index | Geomagnetic Field Conditions | HF Noise | Aurora |
| 0 | 0 - 2 | Very Quiet | S1-S2 | None |
| 1 | 3 - 5 | Quiet | S1-S2 | Very Low |
| 2 | 6 - 9 | Quiet | S1-S2 | Very Low |
| 3 | 12 - 18 | Unsettled | S2-S3 | Low |
| 4 | 22 - 32 | Active | S3-S4 | Moderate |
| 5 | 39 - 56 | MINOR Storm | S4-S6 | High |
| 6 | 67 - 94 | MAJOR Storm | S6-S9 | Very High |
| 7 | 111 -154 | SEVERE Storm | S9+ | Very High |
| 8 | 179 -236 | SEVERE Storm | Blackout | Extreme |
| 9 | 300 -400 | EXTREMELY SEVERE | Blackout | Extreme |
Kp - Planetary K-index, averaged over past 3 hours and tends to be a measure of current conditions
Ap - Planetary A-index, 24-hour average and represents overall geomagnetic field conditions for the UTC day
HF Noise - Approximate "S-meter" noise level <10 MHz
Aurora- Approximate level of auroral activity
- High conditions usually extends to: Latitude 45 deg.
- Very High conditions extends to about: Latitude 35 deg.
- Extreme conditions can extend to below: Latitude 35 deg.
Solar Wind-averages 350-450 km/sec and density <10 p/cm^3 >500 km/sec or high density can trigger geomagnetic activity
Shock Wave- from a solar flare or Coronal Mass Ejection (CME) arrives at the Earth about 55 hours after the solar event.
Solar Flare Classifications
| Flare Class | Type of Flare | HF Radio Effects | Resulting Geomagnetic Storm |
| A |
Very small |
None |
None |
| B |
Small |
None |
None |
| C |
Moderate |
* Low absorption |
* Active to Minor |
| M |
Large |
* High absorption |
* Minor to Major |
| X |
Extreme |
* Possible blackout |
* Major to Severe |
(*) - Conditions cited if Earth is in trajectory of flare emissions
Flare class further rated from 1-9, ex. M1, M2, M3 ... M9
The larger the number, the larger the flare within that class
An X7 - X9 is considered a "Grand daddy" flare. Only a few have occured over the past 30 years, causing total dispruption to communications, huge aurora's, power grid failures, etc.
Radio and x-ray emissions from a flare effect the Earth for the duration of the solar event, usually 30 minutes or less.
Earth is 8 light-minutes from the Sun.
Sunspot/Active Region Classifications
| Sunspot Class |
Description of the Active Region |
Potential for Flare Activity |
| Alpha |
Unorganized, unipolar magnetic fields |
Little threat, but watched for growth |
| Beta |
Bipolar magnetic fields between sun spots | C class flares and possible large M class |
| Delta |
Strong, compact bipolar fields between spots |
High potential for a M or X class major flare Major Flare Alert issued |






 Mt Washington Wx CAM
